Introducing VIA – a complete and integrated solution for the visualization, interpretation and reporting of genomic variants
Existing data analysis solutions for genomics are laborious, time-consuming and incomplete. You have to manage various systems, navigate complex workflows and spend inordinate amounts of time hunting for annotations and creating data visualizations. Good news: those days are over. VIA software radically simplifies your sample-to-report workflow and empowers you to deliver more clinically relevant answers from across technologies faster. VIA brings various data types into one view and automates variant calling, interpretation and annotation, so you can reduce turnaround times and optimize operations at every step.
How it Works
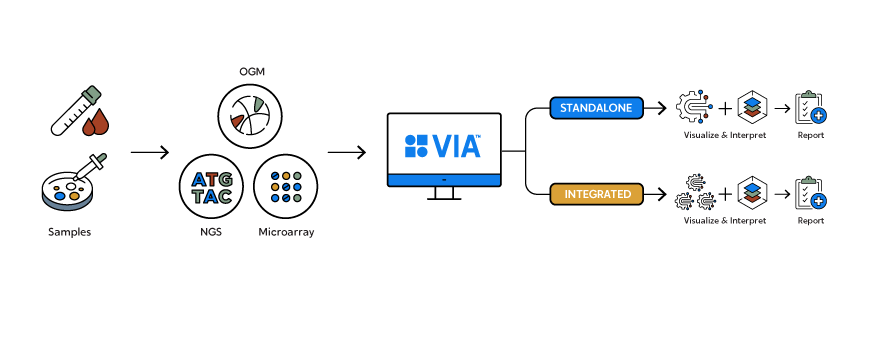
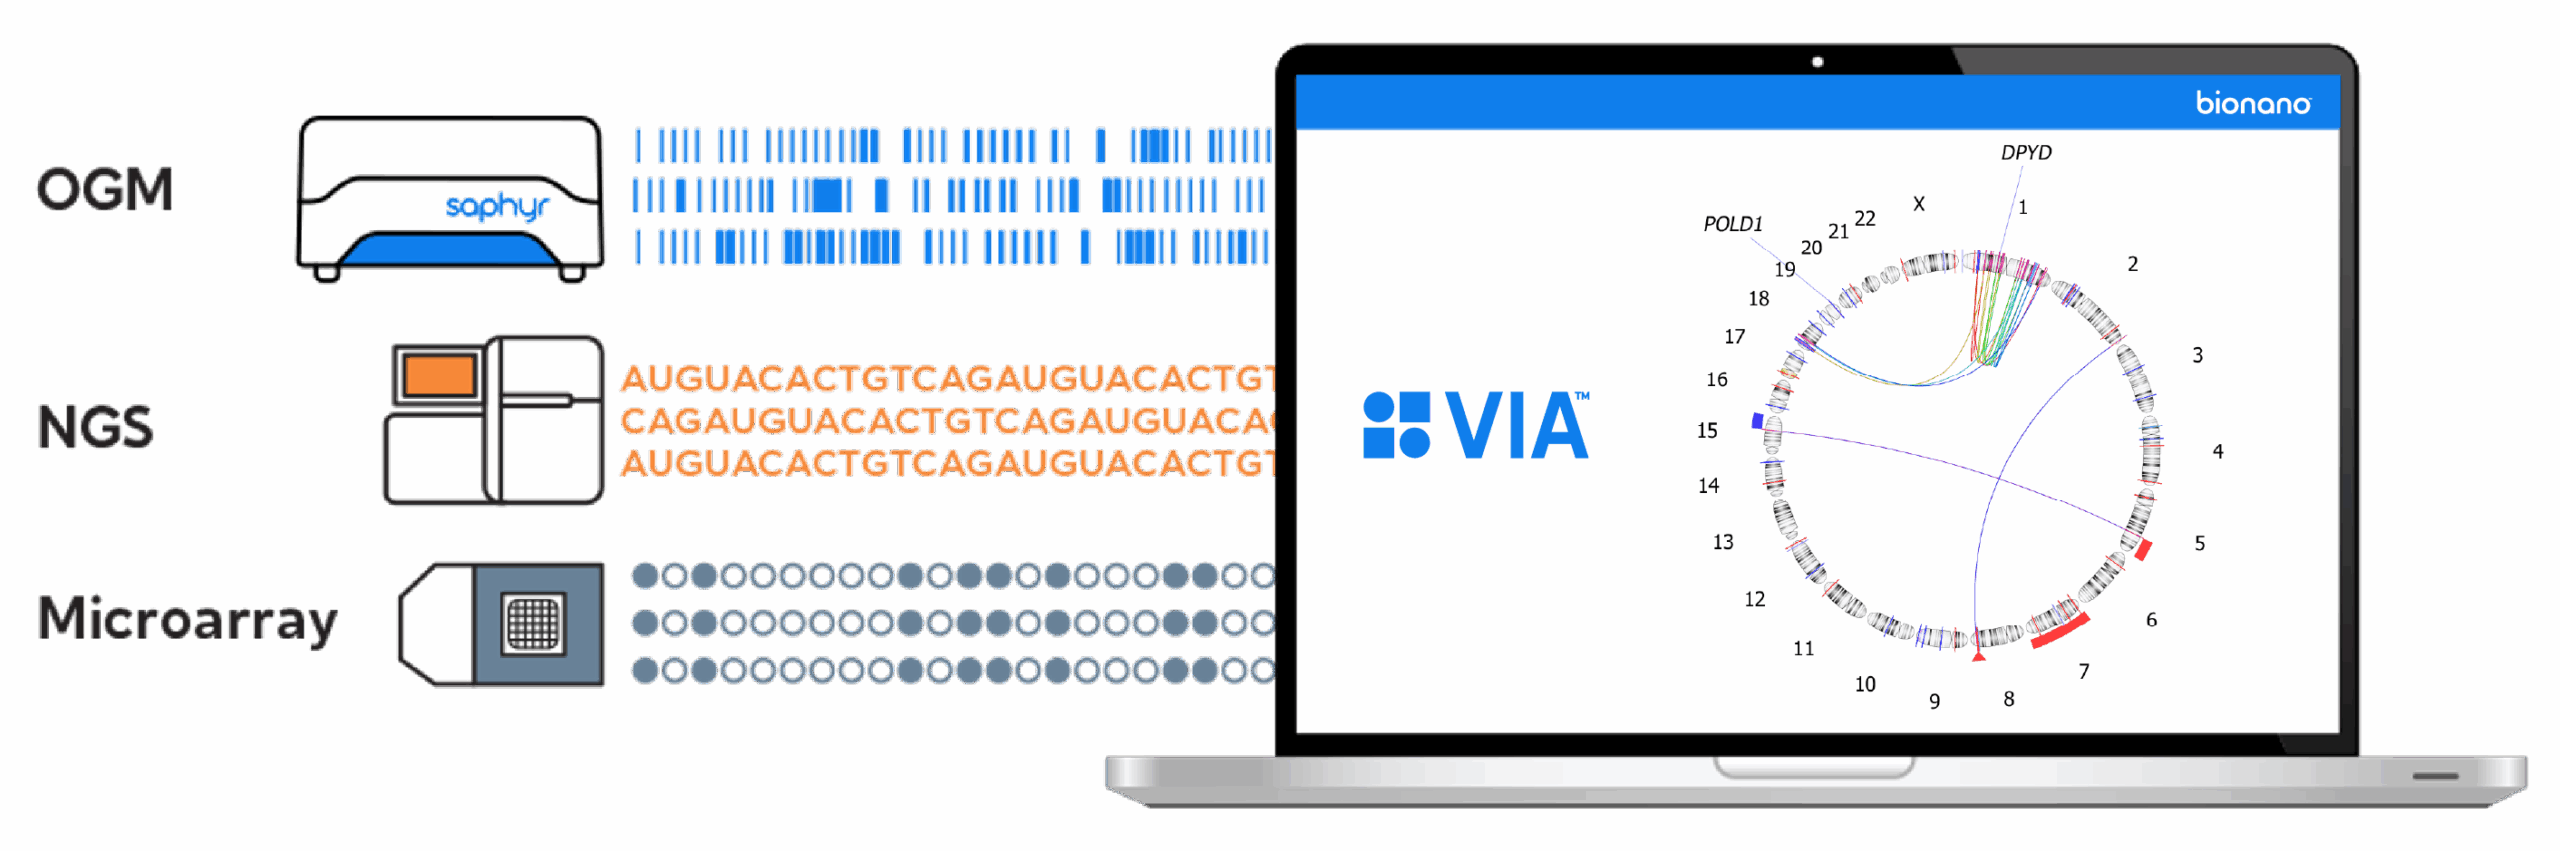
Variant Intelligence Applications™ software is the only analysis software that combines secondary and tertiary analysis, receiving and interpreting data from optical genome mapping (OGM), next-generation sequencing (NGS) and microarrays to contextualize all classes of genomic variation and drive meaningful insights.
Visualize.
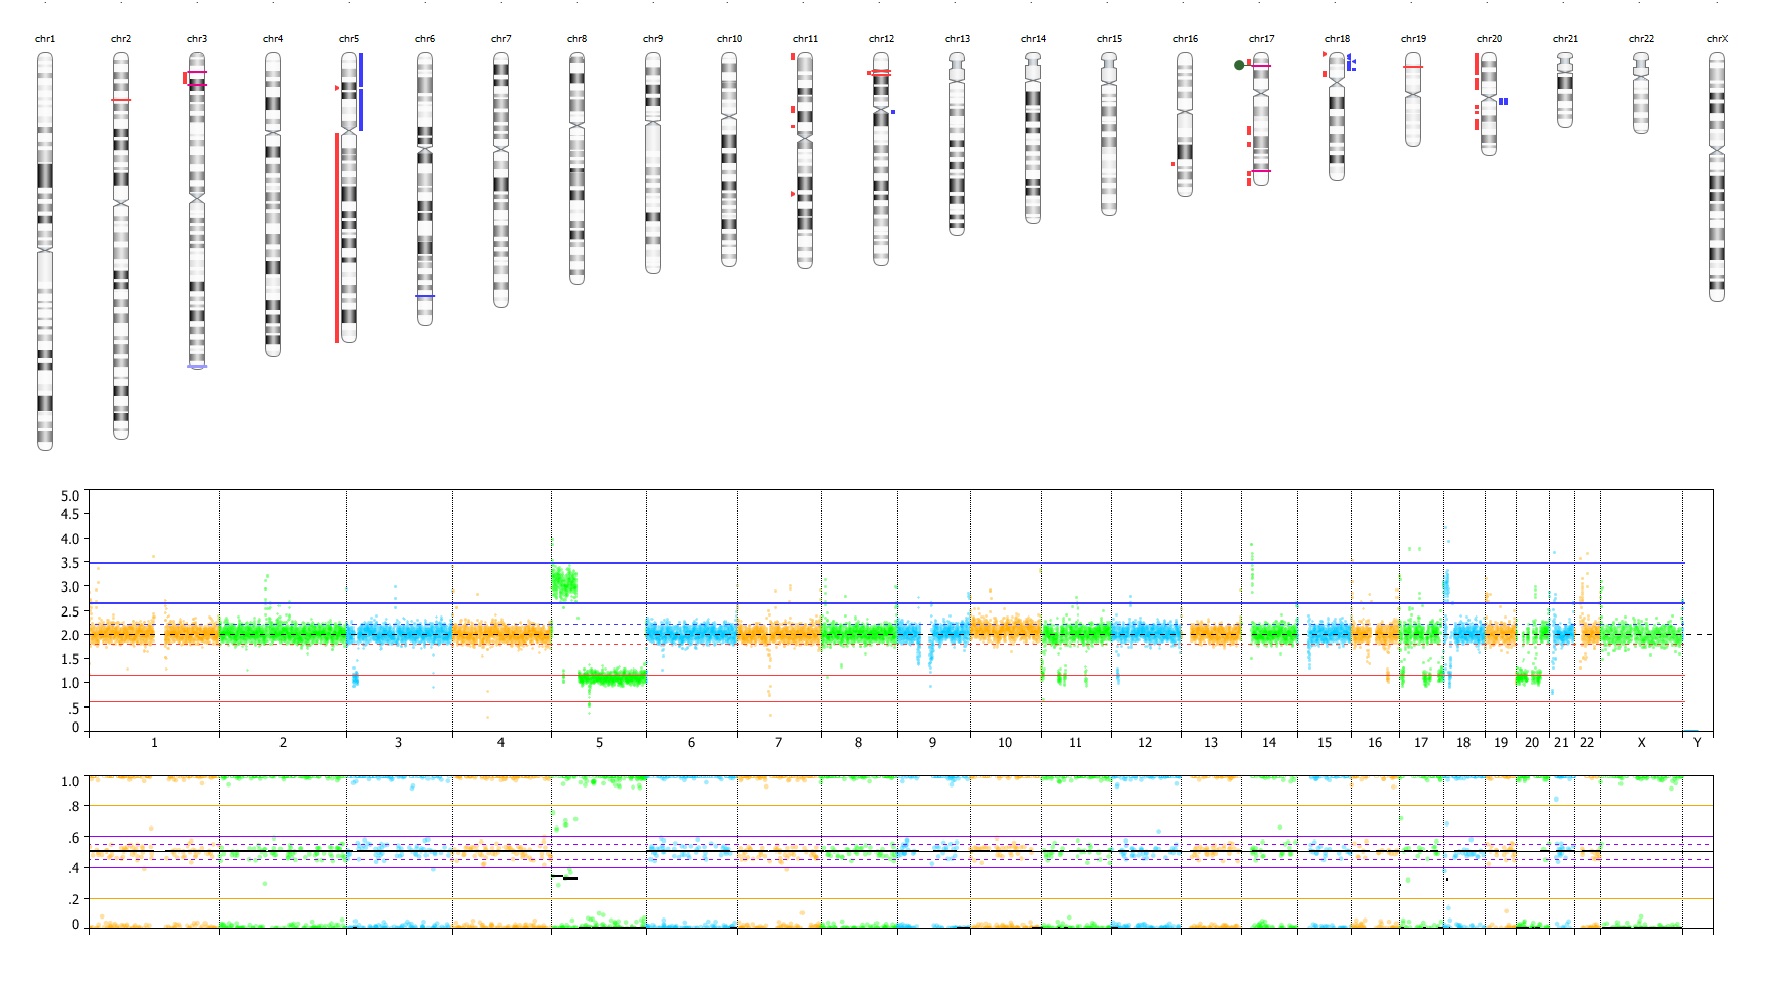
Instant Visualization, Zero Hassle. Automate Data Display for Powerful Insights.
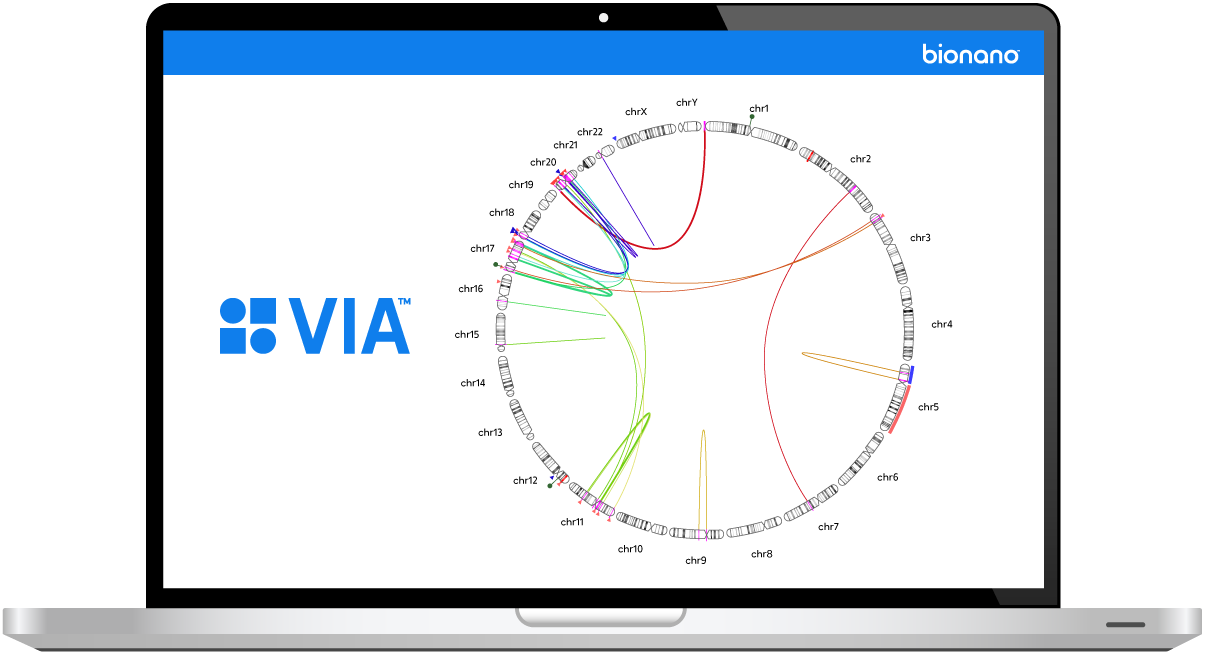
VIA software amplifies the story of your data by automatically generating powerful visualizations for enhanced variant contextualization across multiple variant types happening in the same genomic region.
VIA allows you to drill down to single chromosome, gene, and nucleotide levels for deeper analysis. Leverage multiple views, including genome browser, karyogram, track view, and circos plot.
Interpret.
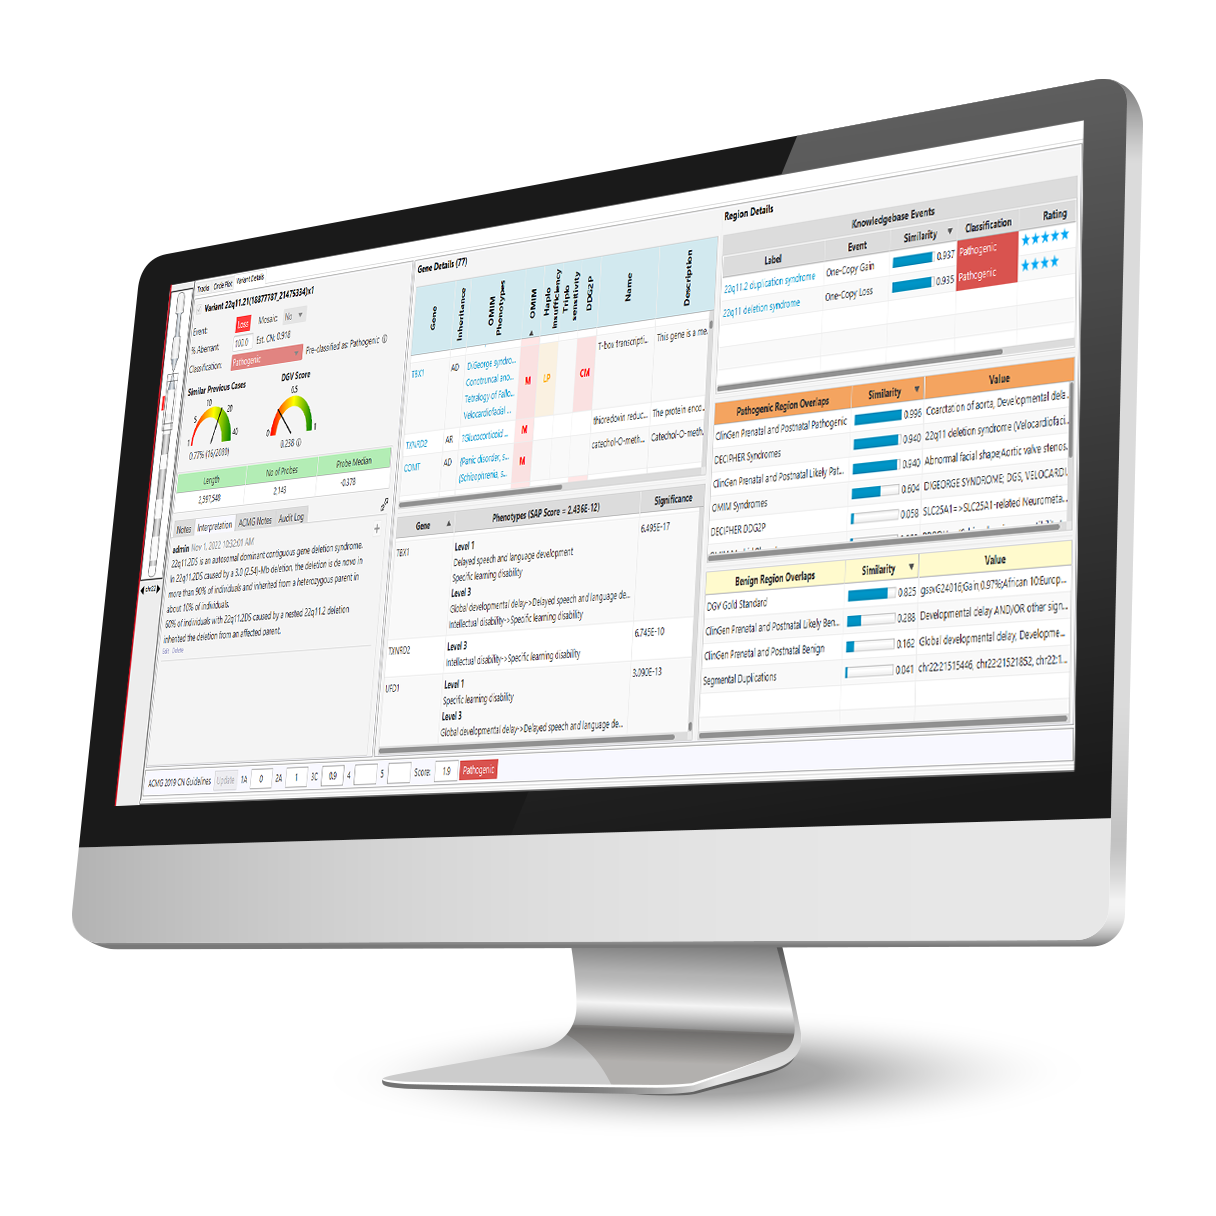
Put Your Analysis on Autopilot and Get to What Matters Faster.
VIA software introduces intelligent automation for filtering, classifying, annotating and interpreting data across technologies, no more hours manually searching through databases.
VIA accelerates time to results to drive faster, informed interpretations while reducing associated costs.
- Annotate: Integrate gene/variant annotation from external databases and previously reported variants from historical data.
- Filter: Automatically classify variants using a rules-based engine, dynamically filter against curated datasets and remove irrelevant variants.
- Interpret: Capture expert interpretation from analysts automatically and implement case signoffs.
Report.
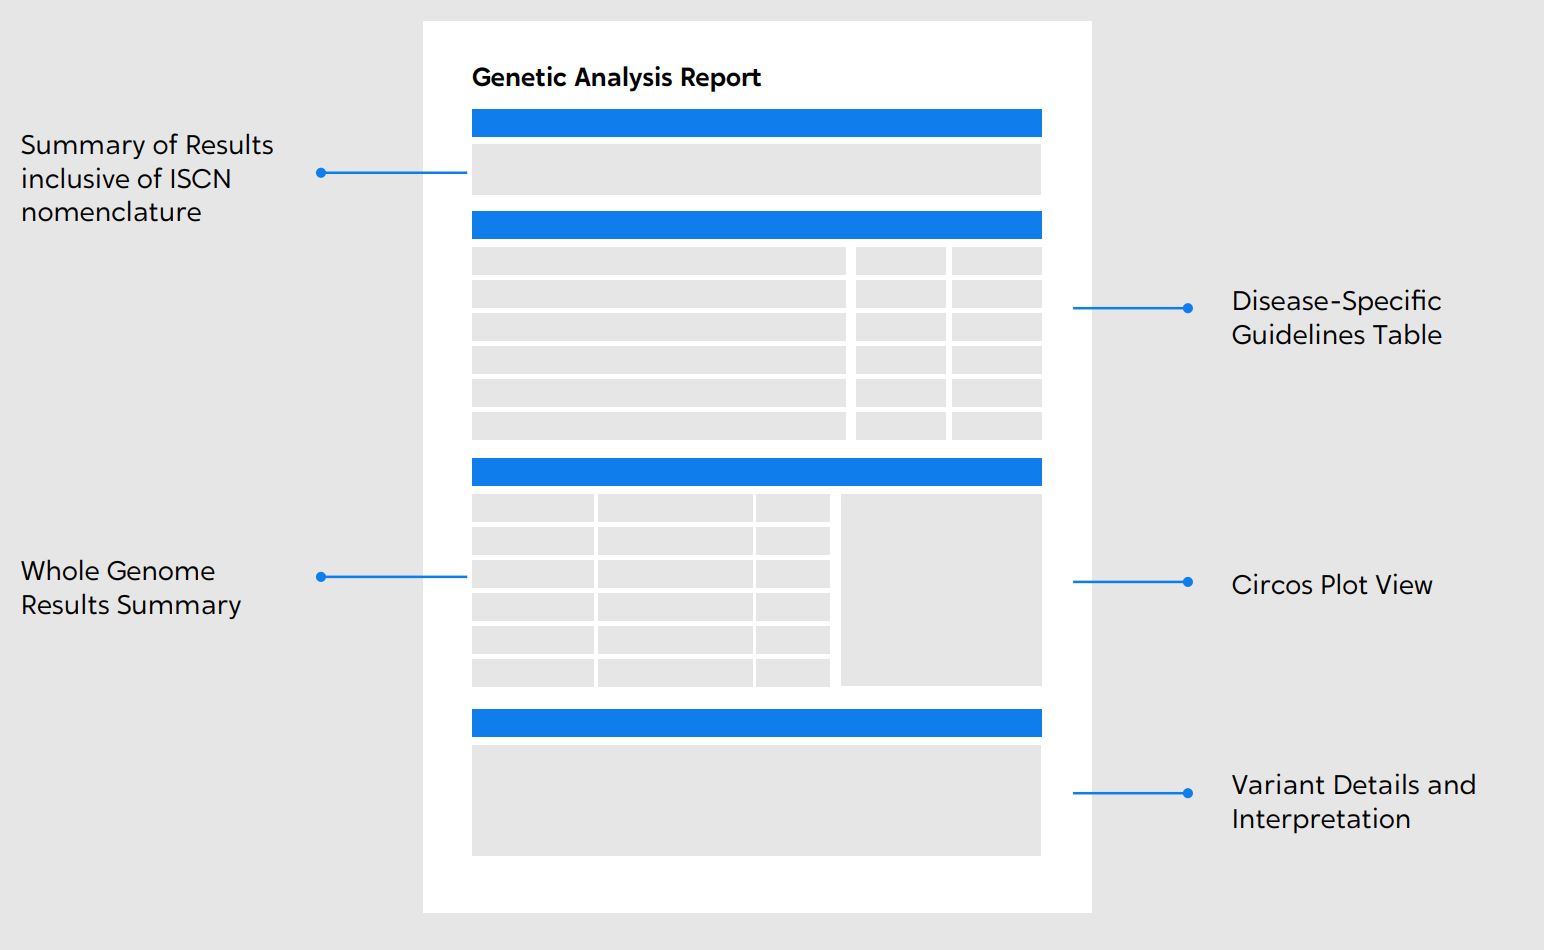
Flexible Reporting that Simplifies Decision Making.
Easily create reports communicating results with simplicity and clarity thanks to VIA’s customizable reporting options. Bring the most relevant information to the surface along with visuals and data that support decision-making that meet guideline-based requirements.
VIA also provides the option for utilizing the new hematological malignancy workflow for a streamlined analysis and reporting solution for OGM data. See the Application Spotlight.
Integrate.
A Single Platform for All Your Variant Data.
VIA eliminates complex data analysis workflows by bringing data types together in one centralized platform, including your historical data from previous cases. You can seamlessly transition between technologies and all classes of genomic variation within VIA software.
- View and analyze OGM, NGS, and microarray data without switching between systems.
- Perform analysis of structural variants, copy-number variants, allelic imbalances, single nucleotide variants and indels for enhanced discovery of causative findings that may be missed if analyzed independently
- Retain and recall historical case interpretations for faster analyses.
Application Spotlight
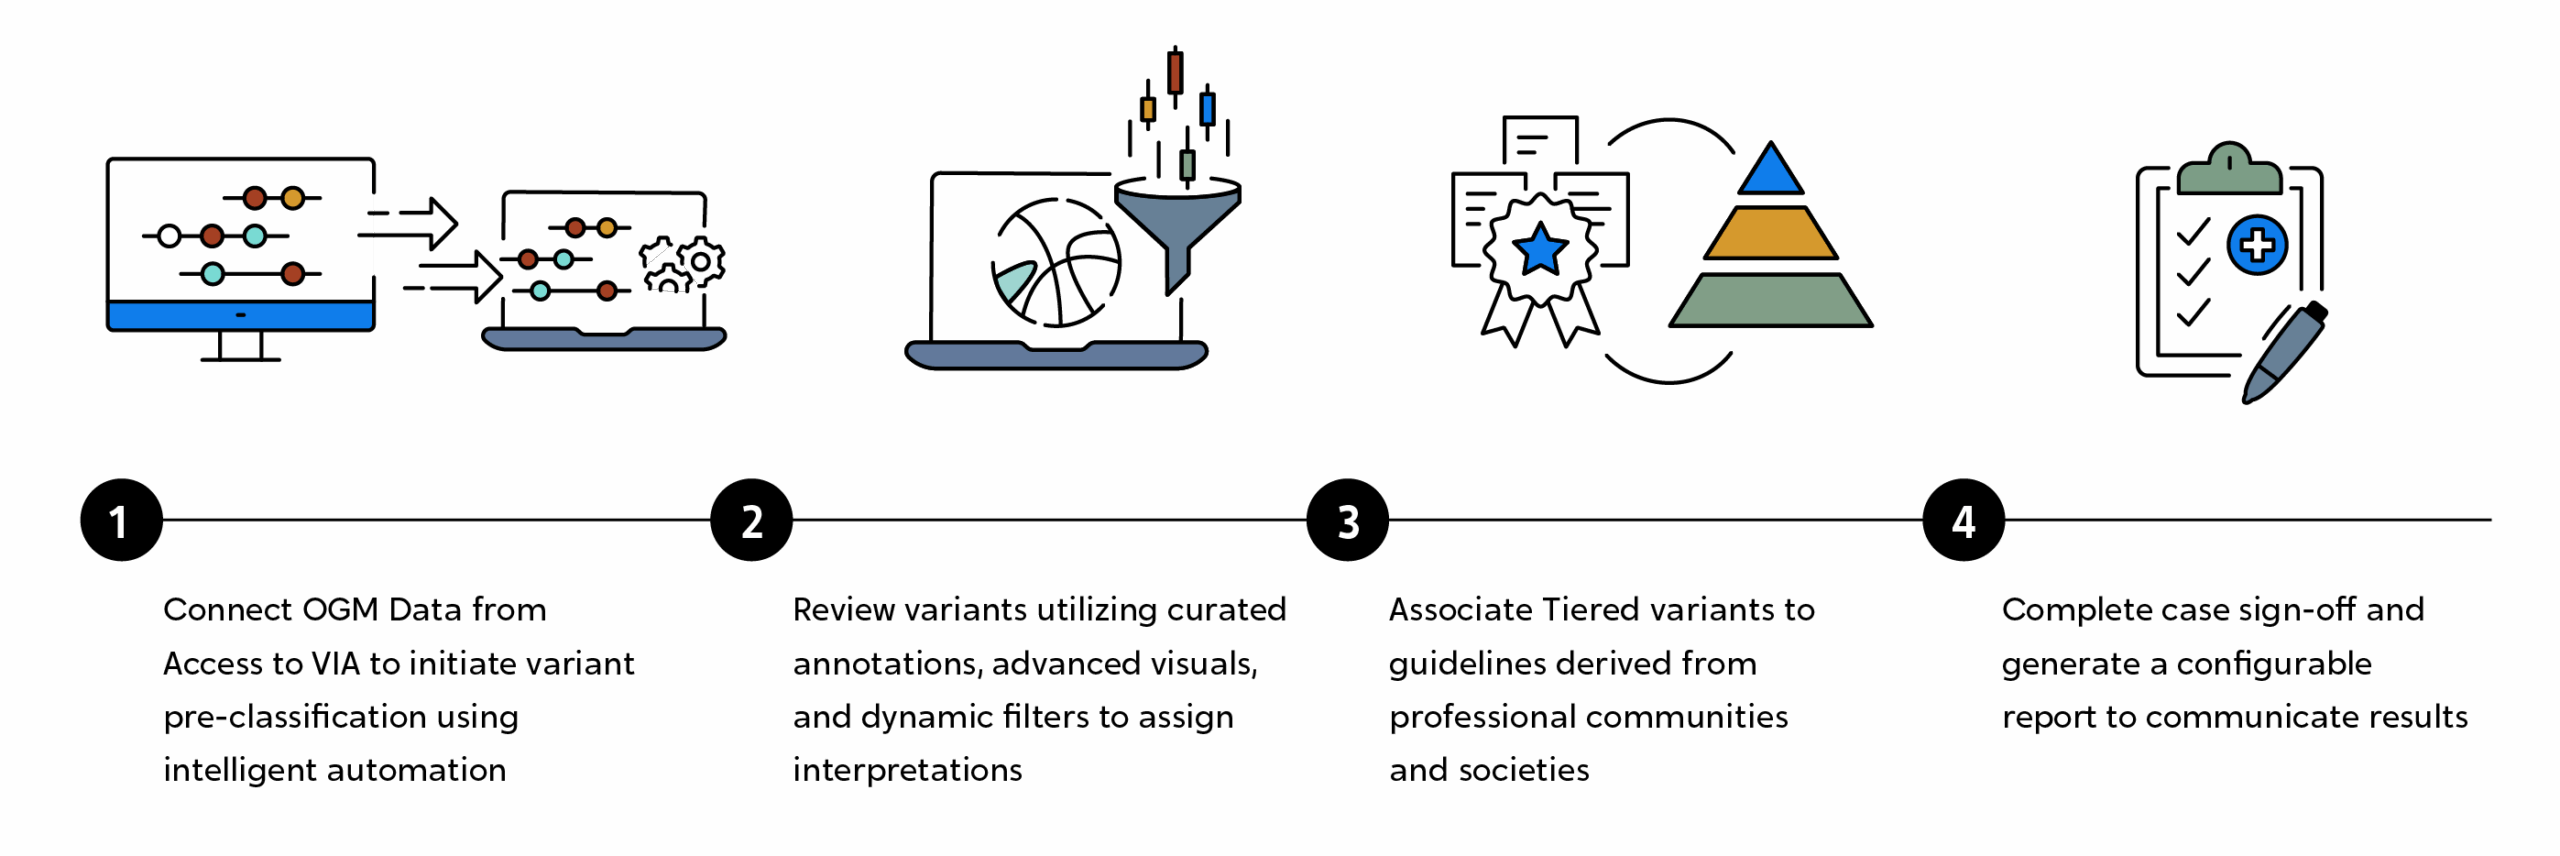
The latest versions of Bionano Solve, Bionano Access™, and VIA software combine to deliver a comprehensive and automated workflow for analyzing, interpreting, and reporting SVs and CNVs detected by OGM associated with hematological malignancies.
This complete workflow leverages intelligent software automation to reduce the time to result for hematological malignancy sample data from OGM, including curated resources in VIA software that represent guideline-based targets applicable to hematological disease. VIA software automatically pre-classifies variants detected with OGM according to a rules-based engine to classify events based on pathogenicity or variant tiering system.
These oncology workflows are configurable to your site-specific preferences.
Expert Insights
Learn More about VIA Software


Read more about homologous recombination deficiency and how Bionano VlA software provides in-depth analysis of HRD
Read White Paper
Learn more about the value of integrating multiple datasets. Download a list of recent publications where OGM was combined with NGS to investigate disease cases.
Download SummaryExperience VIA in Action

VIA 7.2.1 Software Features
Brian Lee, PhD, Software Application and Customer Solutions Manager at Bionano, explores new OGM sample analysis features in VIA 7.2.1
Watch Now
Optimizing Hematological Malignancy Insights: Leveraging Advanced Informatic Platforms for Structural Variant Analysis from Optical Genome Mapping Data
Dr. Susan Crocker, PhD, FCCMG, Director of Cytogenetics at Kingston Health Sciences Center, shares her findings from several examples analyzed by OGM and VIA software, shedding light on how this innovative approach is revolutionizing her research lab.
Watch Now
Viva VIA from OGM Analysis Workflow for Heme Oncology
Sam Dougaparsad Ph.D., Senior Technical Specialist at Bionano, demonstrates how to use heme oncology analysis features in VIA software using an example OGM heme sample. This session begins with the sample in the VIA home page, then dives into the sample review and reporting capabilities of the software.
Watch Now
Introduction to VIA Software Features for OGM Analysis
Brian Lee, PhD, Software Application and Customer Solutions Manager at Bionano, dives into software architecture and OGM sample analysis features in VIA.
Watch NowVIA Blogs

Identifying Causal Variants in Mendelian Diseases: Common Pitfalls and Strategies


Hear What Some of our Customers Say About Their Experience with Bionano Software Solutions in Their Research
Downloads and Resources


See How the Software Works
Talk to a specialist to discuss how you can benefit from VIA in more detail or request a demo to review the software to see how it can detect and analyze genome-wide variation.
Contact UsRelated Products