Blog
Next-Generation Sequencing CNV Detection & Analysis: A Quick Guide
If your time is short:
- Despite copy-number variants (CNVs) being a genetic cause of multiple hereditary and acquired diseases, detecting them from targeted next-generation sequencing (NGS) data remains a challenge for labs. Most analysis tools available today perform well for detecting some types and sizes of CNVs but struggle with others.
- Today, there are four main methods for detecting CNVs with NGS data: read-pair, split-read, read-depth, and assembly. Read-depth is the predominant method used in NGS-based CNV calling. However, this method is insensitive to small insertion or deletion events and is not applicable for detecting CNVs in low-complexity regions with segmental duplication.
- Coverage and uniform coverage contribute to the best resolution of CNV calling by NGS. Compared to targeted sequencing, whole-genome sequencing provides better sensitivity, specificity, and accurate breakpoint detection. Accurate breakpoint identification facilitates accurate variant classification.
- Bionano’s NxClinical™ software, developed by BioDiscovery, has developed proprietary algorithms which have been perfected for detecting CNV and AOH from almost all NGS assays. Learn more about NxClinical software for detecting CNVs from NGS and request a demo to see it in action.
High-quality detection of CNVs from NGS data has been a long-standing challenge for clinical research labs. Most “off-the-shelf” NGS analysis software tools are focused on detecting single nucleotide variants (SNVs), and can’t easily detect or visualize CNVs.
Without powerful and convenient CNV calling capabilities, labs are left with an incomplete picture of genomic aberrations and, therefore, can’t fully investigate their samples and provide complete results.
At Bionano, we equip labs with the single-source software solution they need to overcome this challenge. NxClinical software is, what we believe, to be the most comprehensive and up-to-date solution for cytogenetics and molecular genetics in one system for analyzing and interpreting all genomic variants, including CNVs, from microarray and NGS data.
- NxClinical software is platform-independent. It accepts various data types that enable clinical research laboratories to process CNVs, SNVs, AOH/LOH (and soon structural variants (SVs) from OGM)—all in a single place.
- These aberrations visualized in one software provide a complete picture of a sample’s genome, enabling labs to work more efficiently and confidently.
- In short, NxClinical software brings genuine CNV clarity and resolution to an otherwise difficult data type.
Here, we review the basics of CNV detection from NGS data and explore the methods and tools labs are using right now to fully investigate their samples and make the right calls in record time.
Watch our free recorded webinar which accompanies this guide for more on the points made here, and in-depth case studies demonstrating CNV detection from NGS data using samples from our valued customer, PerkinElmer Genomics.
Using NGS data for CNV detection has been gaining attention in recent years due to the utility of understanding SNVs in the context of CNVs and the ability to detect and visualize these variant types simultaneously.
A considerable amount of research has been published demonstrating the clinical utility of NGS technology for CNV detection, some of which we’ve listed below.
- Comparative Studies of Copy Number Variation Detection Methods for Next-Generation Sequencing Technologies (PLoS ONE, 2013)
- High-resolution mapping of copy-number alterations with massively parallel sequencing (Nature Methods, 2008)
Detecting CNVs with NGS data
There are four main methods of detecting CNVs with NGS data:
- Read-Pair (RP)
- Split-Read (SR)
- Read-Depth (RD)
- Assembly (AS)
We briefly explain the mechanics and application of each of these methods below.
1. Read-Pair
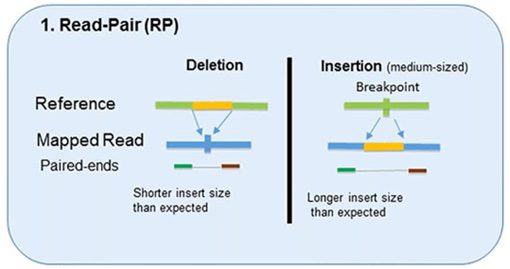
The read-pair methodology first demonstrated the usefulness of NGS data for CNV detection.
This methodology compares the insert size between the actual sequences’ read-pairs with the expected size based on a reference genome.
- The discordance between mapped paired-reads whose distances are significantly different from the predetermined average insert size is utilized by read-pair to identify CNVs.
- The read-pair method can detect medium-sized (100kb to 1Mb) insertions and deletions from mapped data.
- However, this method is insensitive to small insertion or deletion events (<100 kb) or even intragenic deletions and duplications.
- This method is not applicable for detecting CNVs in low-complexity regions with segmental duplication.
2. Split-Read
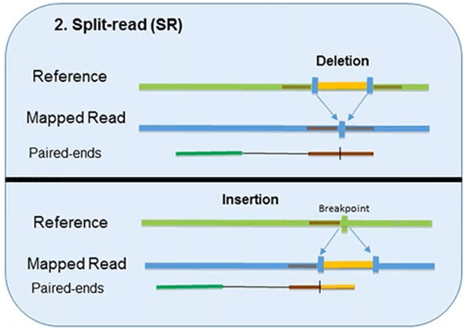
The split-read method uses reads from paired-end sequencing where only one pair has reliable mapping, and the other either entirely or partially fails to map to the genome.
The unmapped reads are a potential source of breakpoints at the single base-pair level.
However, this method has limited ability in identifying large-scale sequence variants (1Mb or longer). Pindel, one computational approach, has been shown to compute deletion events as large as 10 kb. Another approach, Splitread, has been shown to detect structural variation from 1 bp to 1 Mb within exome sequence datasets. A third program, SVseq, finds the breakpoints of deletions around a resolution of 1 bp.
3. Read-Depth
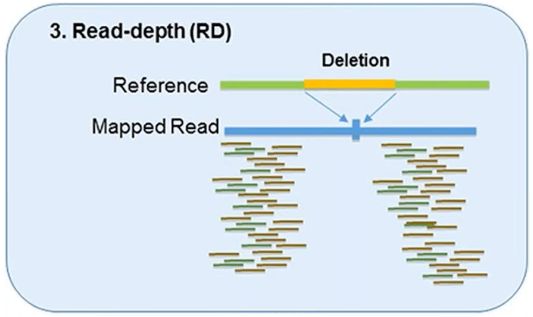
The read-depth method is based on the hypothesis of a correlation between the depth of coverage of a genomic region and the copy number of the region.
This method can detect the dosage of CNVs and works better on large-sized CNVs.
This method can also detect medium-sized insertions and deletions from mapped data.
However, this method is not capable of reliably detecting small insertion or deletion events, and its sensitivity can vary by platform and assay.
4. Assembly
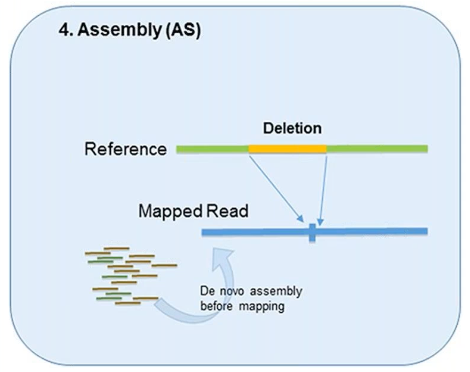
In theory, all forms of genetic variation—including CNVs—can be detected by the assembly of short reads if the reads are sufficiently long and accurate.
This method was designed to better identify structural variation.
However, it’s used less in CNV detection due to the overwhelming demand it can put on computational resources.
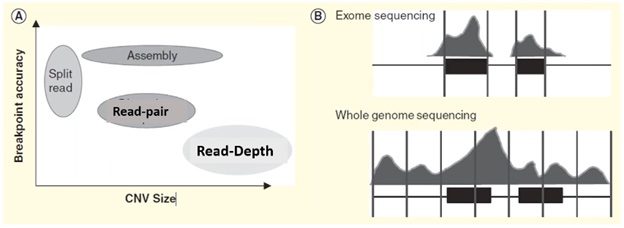
Each of these four methods specializes in detecting a specific form or size range of CNV and results in a trade-off in breakpoint accuracy.
In the plot on the left side of the visual below, we can see that the split-reads and assembly methods are superior in providing accurate breakpoint identification, while read-depth works better in identifying a broad range of CNVs.
In practice, the read-depth method is most like CMA and is the predominant method used in NGS-based CNV calling.
Microarray vs. CNV calling by read-depth
To better understand CNV calling by read-depth, let’s briefly revisit how microarrays work to call CNVs.
Microarray technologies utilize probes for CNV detection. Those probes are:
- ssDNA oligomers (≥ 25 bp)
- Sequenced complementary to the target sequence in the genome
- Have a fixed length equal to the size of the oligomer
CNVs are detected by comparing the sample to a reference using the light intensity of labeled DNA. However, the probe density across the genome can be variable.
The image below demonstrates the probe distribution in a chromosome. The probes in the microarray are more focused on the clinical region but can be loose in the non-disease regions. Some backbone probes are used to catch large CNVs during the normalization stage.
The read-depth method for NGS CNV calling uses probes, too. Instead of ssDNA oligomers, this method employs a virtual probe, a window of a genomic sequence at a specific location (example below).

- The length of a virtual probe is defined and modified by the user during reference set creation.
- Users can adjust virtual probe size to optimize sensitivity and specificity.
- Like microarrays, CNVs are detected by comparing a sample to a reference. Rather than measuring light intensity, however, this NGS method counts the number of reads within the genomic window.
- With whole-genome sequencing (WGS), this method provides equal coverage across the genome thanks to uniform coverage across the genome.
Read-depth comparison between sample and reference sets
Looking more closely at the read-depth method for CNV detection from NGS, the number of reads for a specific location is compared between the sample and the reference set, as visualized below.
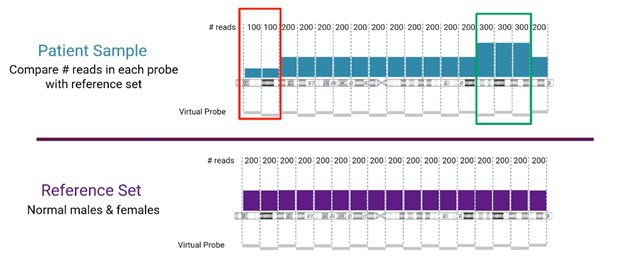
In this example, we’re looking at human chromosome 3. The reference set (from normal male and female samples), in this case, is divided into sets of 200 reads. The sample is compared to the corresponding reference set. Areas, where the sample does not match the reference, will indicate either a copy number loss or gain event (marked in red and green, respectively, in the example).
Using NxClinical software to call CNVs from NGS, the image below shows an alternative example of the resulting analysis for CNVs on chromosome 1.
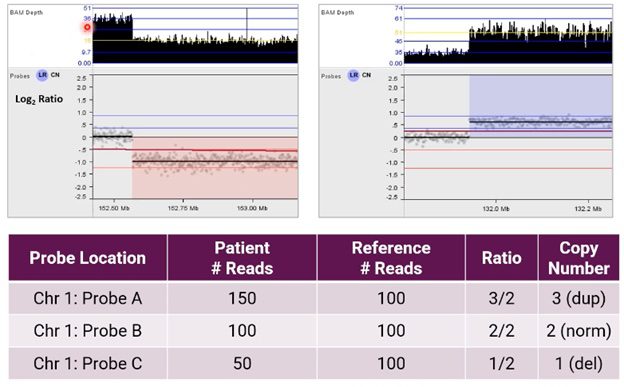
Here, the user can see BAM depth (an output of our BAM analysis algorithm) and a graphical representation of these probes in a Log2 Ratio copy number plot after normalization.
Go deeper in our free webinar
Copy Number Variant Detection by NGS: Coverage, Uniformity & Resolution
Watch our free recorded webinar and join Dr. Fen Guo, Ph.D., FACMG, FCCMG, Clinical Laboratory Director, PerkinElmer Genomics, for a much more detailed look at how virtual probe length and uniformity contribute to the sensitivity and specificity of CNV calling using NGS data, and how labs use NxClinical software to optimize their analyses accordingly. Dr. Guo presents four case studies of CNV analysis from NGS data as well.
Detect CNVs and AOH regions and visualize SNVs in context across microarray and NGS platforms simultaneously—all from a single screen
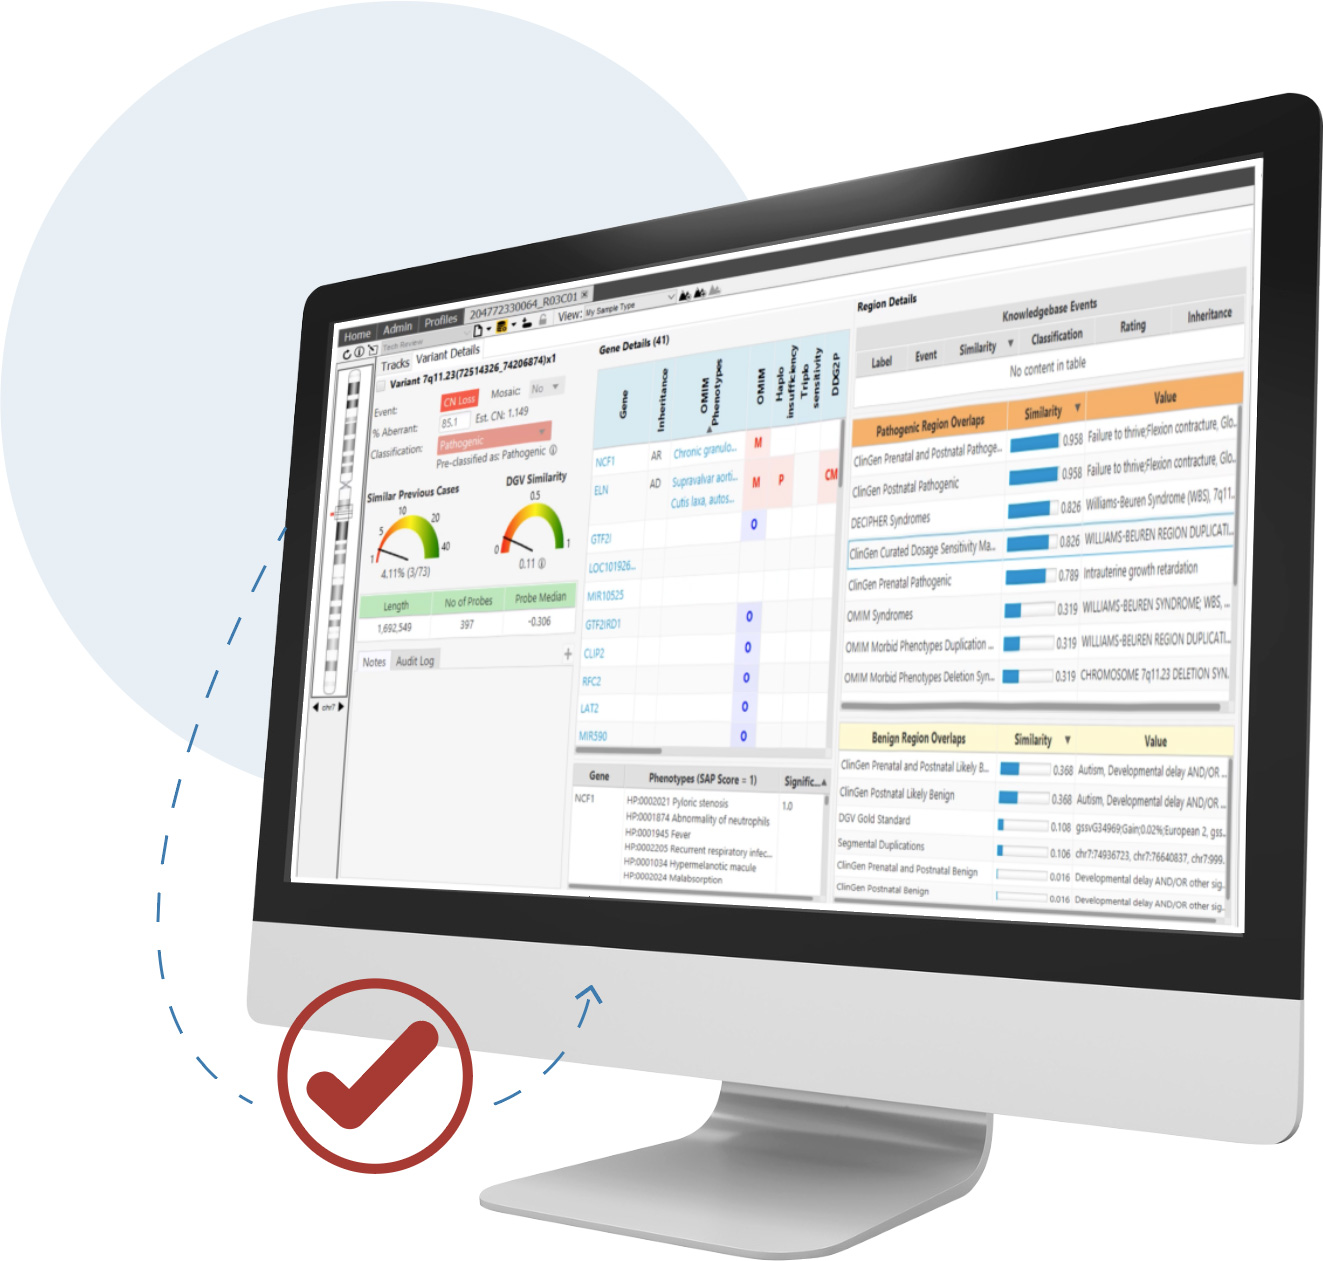
CNVs are an important contributor to disease and are required for accurate analysis. For clinical research sequencing to be fully accepted as a replacement for microarrays and other widely used techniques, it must provide high-quality CNV information.
NxClinical software can easily and accurately provide that information from various approaches using NGS data.
NxClinical software has two algorithms for the detection of CNV and AOH events from NGS using its decades-long expertise in the area.
- One algorithm, the “Self-reference” algorithm, can be used for all WGS data regardless of sequencing depth.
- The second is the “Multi-Scale Reference” (MSR) algorithm that is applicable to all NGS data (WGS, WES, and Gene panels). The MSR algorithm is able to create “virtual” bins with sizes proportional to the expected number of reads offering high-resolution detection of events in areas of interest (e.g. exons) while also providing a nice genome-wide backbone.
At Bionano, we see the true value of NxClinical software in its ability to provide powerful parallel analysis of NGS and arrays. With NxClinical software also being platform-independent, labs using it have virtually eliminated their tech transfer step. You’ll never have to change to a new variant interpretation software no matter which assay platform you choose to consider.
Ready to detect CNVs from NGS?
Request a free personalized demo of NxClinical software and see its CNV detection capabilities in action. We’ll connect on an initial consultation to answer questions and dive a little deeper before demonstrating the latest version of NxClinical software—either with example data or your own.
*For Research Use Only. Not for use in diagnostic procedures.
© Copyright 2022 Bionano Genomics, Inc. All rights reserved. All trademarks are the property of Bionano Genomics, Inc. or their respective owners.
