Blog
Diploid Recentering: When, Why and How
It is well established that cancer frequently undergoes copy number changes, which is why copy number is frequently evaluated in cancer samples for diagnostic and research purposes. However, when beginning copy number analysis of a sample using a SNP array, it is important to run a quick sanity check to validate that the baseline calling is in fact calling diploid regions. In simple terms: Are the “normal” areas normal?
SNP arrays give information for both copy number and b-allele frequency. With most copy number analysis, median recentering is selected by default. This is appropriate when a sample is close to diploid. However, when the overall ploidy strays due to extensive gains or losses, as is typical in many cancer samples, median recentering can lead to false calling.
Therefore, when evaluating an individual cancer sample, there are a few red flags to watch out for:
– Are there extensive copy neutral (baseline) areas with allelic imbalance (purple)?
– Are there extensive areas of copy number loss (red) without any corresponding allele change (purple allelic imbalance or yellow loss of heterozygosity)?
– Are there extensive areas of gain (blue) without any corresponding allelic imbalance (purple)?
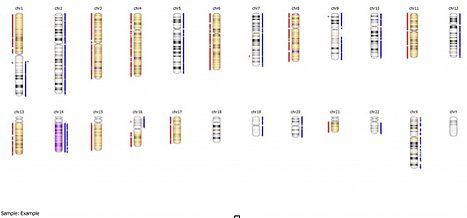
Here is one such example:

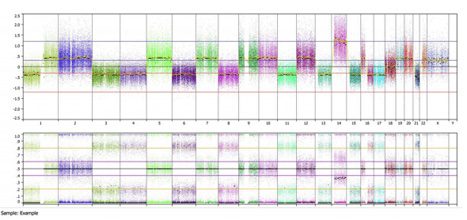
As you can see in this example, there are extensive “gains” of chromosomes 2, 5, 7, 9, 10, 12, 19, 20,and 22, with no corresponding allelic imbalance, while the copy number loss regions all show appropriate loss of heterozygosity. If we look at the whole genome view, we can get further information:

The top panel shows the copy number calling (note this is an Affymetrix MIP array, so everything is shown in a linear copy number scale). We can see many areas called as loss (~-0.4) and gain (~0.4), but almost nothing is called at the baseline state (0). When we look at the bottom B-allele frequency panel, we can see many regions of balanced heterozygosity, as noted by the typical 3 band pattern (spots at 0, 0.5 and 1.0). These areas include chromosomes 2, 5, 7, 9, 10, 12, 19, 20,and 22; all of the areas that are also marked as “gained”. Chromosome 14 shows a typical 4 band allelic imbalance pattern, but is marked as high amplitude gain (~1.2).
We can recenter this sample to the balanced regions of heterozygosity identified above, thus defining these chromosomes as diploid. Within Nexus Copy Number software, this is done by:
- Adding the factor “Diploid Regions” on the data set tab
- Naming the diploid regions in the sample (chr2,chr5,chr7, chr9, chr10, chr12, chr19, chr20, chr22)
- Adjust the settings to Recenter: Diploid Regions
- Highlight the selected sample and Reset
- Re-process the sample with the new settings by selecting View
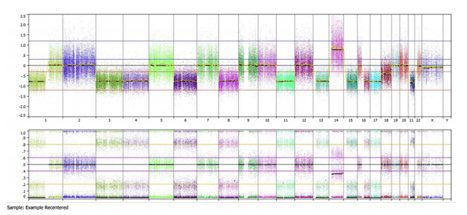
Once recentered, this essentially shifts the top copy number panel while maintaining the identical lower B-allele frequency panel, as shown in the full genome view below:

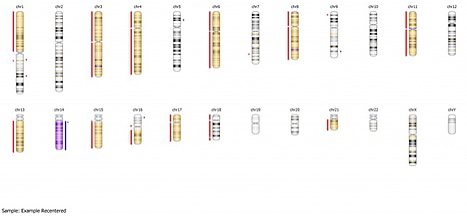
Now this sample looks as expected: we see areas of copy number loss in the top panel are associated with loss of heterozygosity in the bottom panel for chromosomes 1p, 3, 4, 6, 8, 11, 13, 15, 16, 17, and 21. We see copy number gain on chromosome 14 is associated with allelic imbalance on the bottom panel. Furthermore a baseline diploid state is associated with a normal 3 band heterozygous pattern for chromosomes 2, 5, 7, 9, 10, 12, 19, 20, and 22. This is reiterated in the summary view below:

As you can see, if we had not recentered this sample, we would have had extensive false positive calling. Again, default median recentering is appropriate in samples that are close to diploid, and it is always a good place to start. For a sample like the one above, where the actual ploidy is closer to 1.5, further recentering to specified regions may be required. However, paying attention to the red flags outlined above will help you to recenter the sample and should yield positive results for your downstream analysis.
Drilling down to the whole genome view can also be useful for estimating the percentage of aberrant cells in a sample, or identifying potential areas of chromothripsis.
